Debugging on Android
If you previously gave up on using an IDE integrated debugger for Android development, have another look. Until about a year ago my opinion was that they’ve usually more frustration than they’re worth. (This opinion is by no means widespread.) The IDE integration in Eclipse never performed consistently enough on any of my development environments to make it more help than hindrance.
Android Studio, however, does pretty well and so I’ve been using it a bit more lately. Unfortunately, you can’t use it to step through C or C++ JNI code yet (this is coming), but on Java it take barely any effort to set up. This article will run through:
- Setting up the debugger in Android Studio
- Stepping through Java code
- WebViews: debugging via Chrome and Console
- Hugo: Annotation-based debug logs
Setting up the debugger in Android Studio
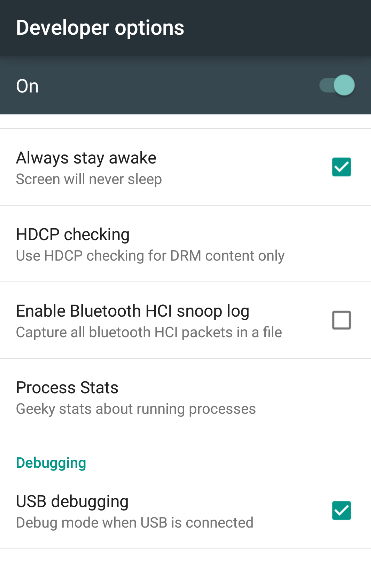
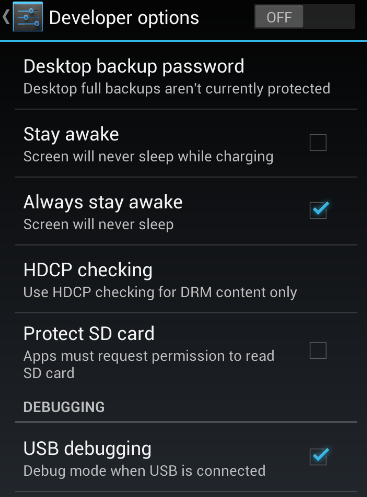
Start up or plug in some device with debugging enabled in the developer options.
Picture:
 |
 |
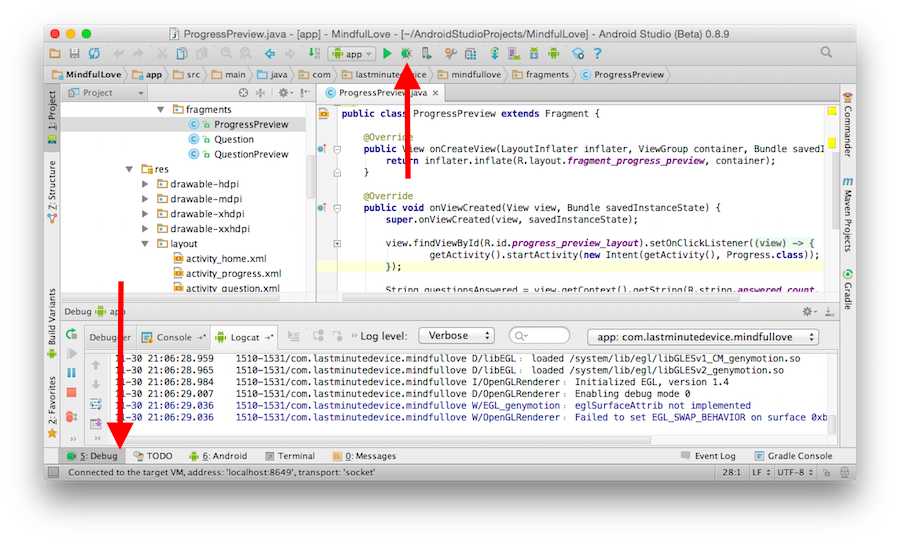
Now in Android Studio, click the bug icon to launch your app and start debugging, or the bug-and-device icon to start debugging an app that is already open. Notice the window that has appeared in your Android Studio workspace.
###Stepping through Java code
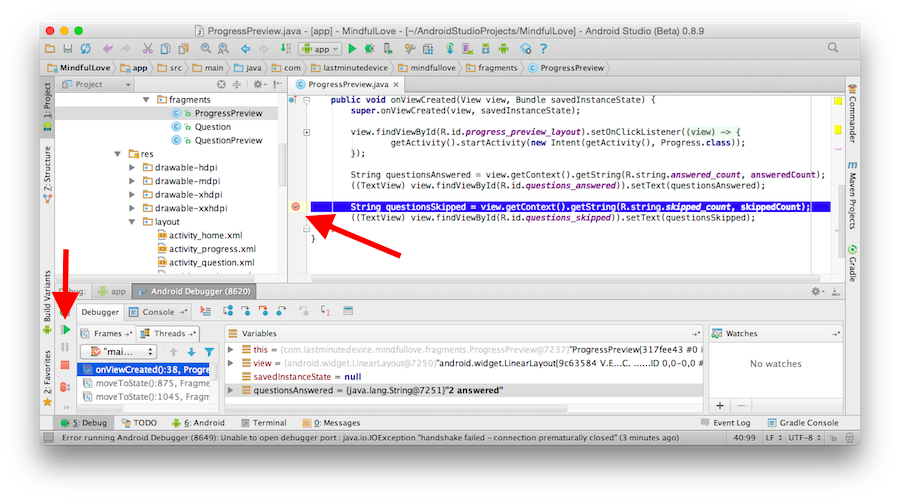
Now set a breakpoint somewhere by clicking next to the line number, or where the line number would be if you were displaying them. A red dot should sit beside any line that has a breakpoint. When execution reaches this line, it will pause. You can then inspect the state of any object in scope. To continue execution, click the little green arrow to the left of the debugging window.
Piece of cake, right?
WebViews: debugging via Chrome and Console
There are a couple of fairly simple ways to debug Android WebView issues; using Console is easy but only gives you messages, and using Chrome takes some setup but gives you pretty much everything.
Chrome
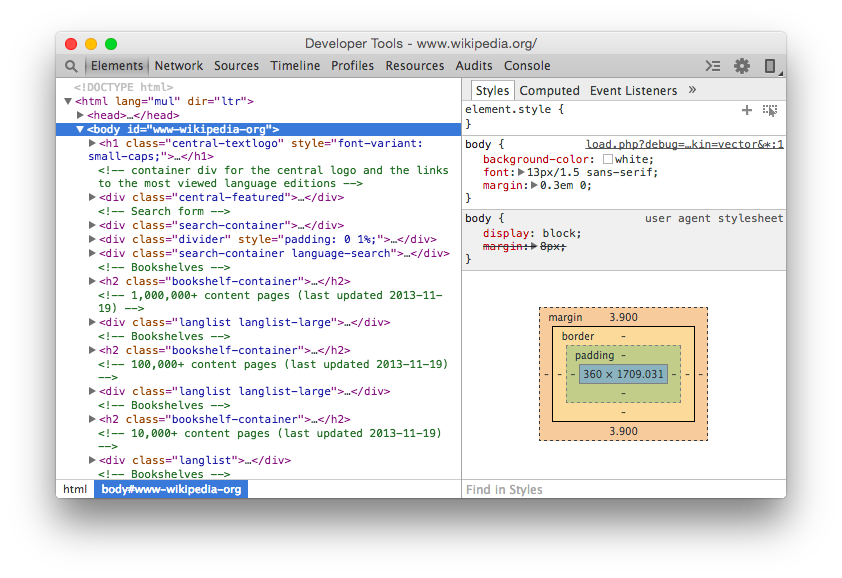
Google gave us a really nice tool with Chrome Remote Debugging. (See the documentation here for full details on how to use this tool.) If you open up an instance of the Chrome desktop browser and navigate to chrome://inspect/#devices, you can see a list of Chrome windows communicating with one of Chrome processes running on the desktop. It’ll show you a preview, let you select elements, show you the Javascript console, and even let you edit things on the fly.
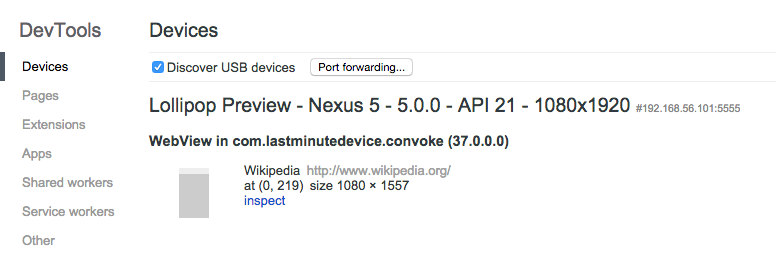
This is great for Android because some WebViews will do the same. WebViews running in an API environment that are at KitKat (4.4) or higher will do this once it is explicitly enabled. The flag, once set, is set for the entire application.
if (Build.VERSION.SDK_INT >= Build.VERSION_CODES.KITKAT) {
    WebView.setWebContentsDebuggingEnabled(true);
}
Console
For debugging in the WebView at API levels lower than 4.4, we can use Console. Details are available on the Chrome developer website here. First, Javascript needs to be enabled.
WebView webView = (WebView) findViewById(R.id.web_view);
webView.getSettings().setJavaScriptEnabled(true);
Then, in Javascript, messages logged via the console object will be sent to LogCat.
console.log('There are two hard problems in computer science.'); I/chromium( 3601): [INFO:CONSOLE(1)] "There are two hard problems in computer science." ...
It isn’t as convenient as having linebreaks etc like you do with the Android Studio debugger, but it’s better than nothing. There are some third party tools for more functionality, but I find it’s easier to debug web pages in a desktop Chrome browser than on the device. In the unusual circumstance that behavior differs, this is usually enough to help me figure the rest out.
Hugo: Annotation-based debug logs
The incredible Jake Wharton published Hugo (GitHub page here) in 2013. What it provides is a whole slew of log statements that profile the application as it executes. This logging is only enabled in debug builds, so it won’t end up in your published application.
For example, say I want to know approximately how much time it takes to initialize a third party library. Annotate the method where this is done like so:
@DebugLog
private void enableFabric(boolean isStageBuild) {
    String key = isStageBuild ? TWITTER_KEY_DEBUG : TWITTER_KEY;
    String secret = isStageBuild ? TWITTER_SECRET_DEBUG : TWITTER_SECRET;

    final TwitterAuthConfig authConfig = new TwitterAuthConfig(key, secret);
    Fabric.with(this, new Crashlytics(), new Twitter(authConfig));
}
… and then LogCat will show when the method begins, as well as the values of any arguments to it and the time it took to execute.
D/Convoke ( 1973): ⇢ enableFabric()
I/Fabric  ( 1973): Initializing Crashlytics 2.0.0.15
D/Convoke ( 1973): ⇠ enableFabric [60ms]
I can see that Twitter’s Fabric library took 60ms (not accounting for my two String assignments there) to initialize on this device, also that this initialization was executed as a staging build.
This library isn’t perfect, I’ve run into compilation issues in the past where the injected code would cause a VerifyError. This has since been resolved.
Between automated logging, breakpoints, and remote Chrome debugging, you can peer pretty deeply into the workings of an Android application without much effort.