Evaluate rendering performance on Android
See performance
Sometimes, especially when working with List/RecyclerViews, it behooves one to work on improving the rendering performance of a given screen in your app. I don't like to optimise blind, and I love automation, so I wanted a way to take a snapshot of the performance of a given area. You can enable a kind of performance overlay and just look at it, but that doesn't give you averages over time and it can't be tied into an automated test, practically speaking.
cookie-butter
My solution was a python script that essentially scrapes dumpsys gfxinfo and produces a chart. (You can get it from GitHub here.)
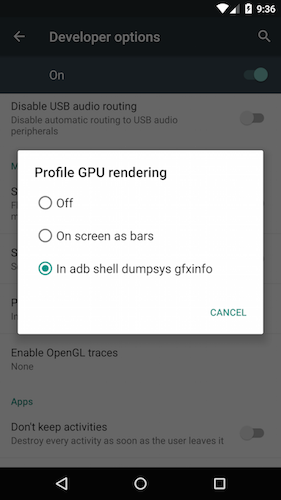
To collect data, go to Developer Options > Profile GPU rendering. Have it send data to the dumpsys buffer. (You can alternatively view it on the screen in real time as bars, though you can't choose both.)
Restart the app you want to measure. The script requires matplotlib, which is included in many distributions of Python, but if you somehow don't have it already:
On Linux:
sudo apt-get install python-matplotlib
pip install matplotlib
Now the fun part. To use the script:
python generate_frametime_graphs.py -h
usage: generate_frametime_graphs.py [-h] package [seconds] [title] [device]

Generate frame time graph for a connected ADB device.

positional arguments:
  package     package to target (ex: com.google.android)
  seconds     number of seconds to collect data
  title       title to use for graph
  device      direct to a specific ADB device

optional arguments:
  -h, --help  show this help message and exit
For example, here's the Clock app shipped with Lollipop:
python generate_frametime_graphs.py com.google.android.deskclock 5 example_graph 078f1fe513d
Median: 5.0ms
Average: 5.0ms
Device framerate: 60.0
Estimated dropped frames: 4
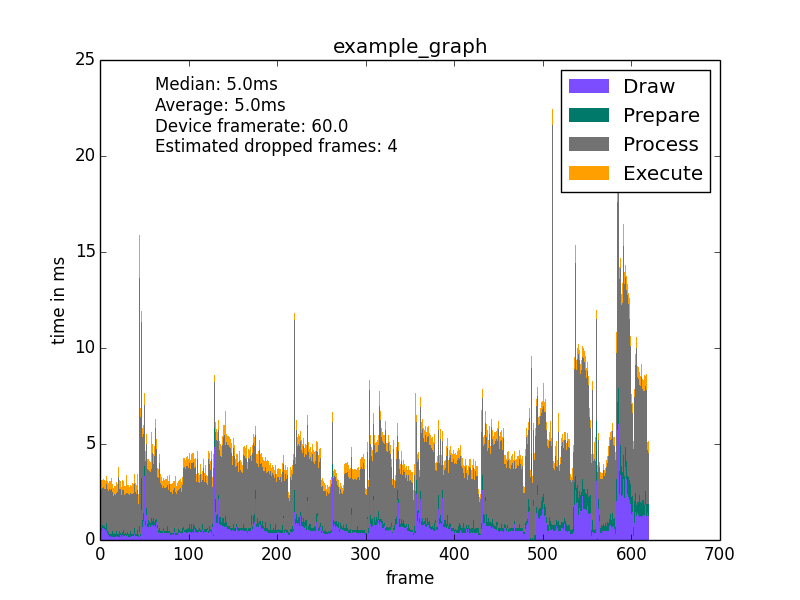
A smooth framerate (not visibly stuttering) is 60 frames per second, or 16 milliseconds to render each frame. You'll want to see the gold-colored curve of that graph stay under 16ms. On emulators, you'll see the gray curve much larger than on a real device, sometimes to the order of ~10ms on Genymotion. That's totally normal, so be sure and check it out on actual hardware before you worry about it.